Personal Connection
This project emerged from a unique convergence of personal and academic interests:
Family Connection: I have relatives from Hong Kong, giving me personal insight into the region’s political and economic evolution.
Academic Connection: My professor is from Venezuela, providing firsthand perspective on a country experiencing dramatic political and economic transformation.
The Question: How do economic indicators and democratic factors compare between regions with vastly different political systems and trajectories? How do they compare to the United States?
Research Challenge
Operationalizing Complex Concepts
The Democracy Problem: How do you measure “democratic freedom” in comparable, quantitative terms across different political systems?
The Economic Challenge: How do you compare economies of vastly different scales, structures, and development stages?
The Data Reality: International datasets are notoriously incomplete, inconsistent, and politically sensitive.
Research Methodology
Rather than accepting superficial comparisons, I focused on:
- Time series analysis to identify trends and inflection points
- Multi-indicator approach combining economic and political metrics
- Interactive exploration allowing users to discover their own insights
- Transparent methodology acknowledging data limitations and biases
Technical Implementation
Key Features
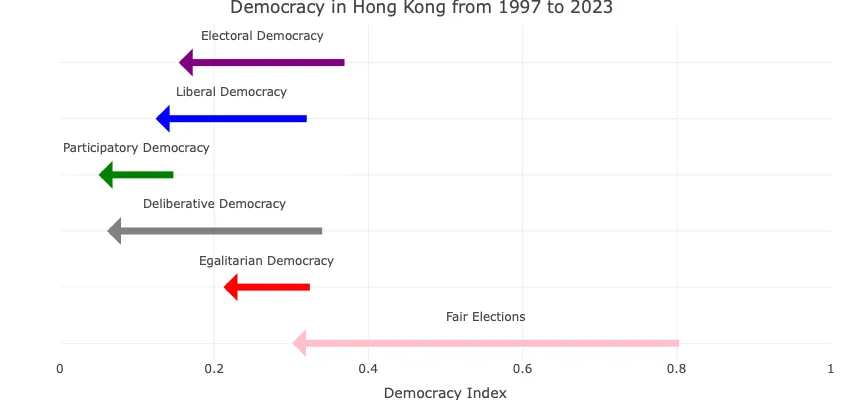
- Arrow plots for democracy factors - Visual representation of political indicator changes
- Economic time series - Historical trend analysis with interactive filtering
- Comparative visualization - Side-by-side analysis tools for GDP and Democracy Index
Data Integration Challenges
Multiple International and In-House Sources:
- Varieties of Democracy (V-DEM) Dataset
- Bayesian Structural Time-Series (BSTS) in-house Datasets
- Maddison Project Dataset
- May Add: Human Freedom Index
Data Cleaning Process:
- Standardizing measurement periods across sources
- Handling missing data points strategically
- Accounting for methodological changes in indices over time
- Normalizing economic data for meaningful comparison
- Normalizing country data across datasets
Learning Progression
Building on a Previous “Failure”
This was my second R Shiny attempt after DataVis taught me crucial lessons:
Documentation First: Spent time understanding reactive programming concepts before jumping into visualization.
Data Structure Planning: Explored and cleaned the data thoroughly before attempting any plots.
Incremental Development: Built simple visualizations first, then added complexity gradually.
Technical Skills Gained
- R Shiny reactive programming with complex user interactions
- International data integration from multiple, messy sources
- Political economy research methodology
- Interactive data storytelling for complex social science topics
- Cross-cultural data sensitivity in presentation and analysis
Key Insights and Findings
Economic-Political Correlations
The analysis further supported patterns my professor had noted about the role in democracy and economics played for Venezuela. Before Maduro or Chávez, Venezuela was one of the most if not the most prosperous nation in South America, comparable to the United States by about 70-80% in the 1950s. Under Maduro in 2013, there was a really sharp drop in the economy by about 70% with a ~10.5% reduction in basic democratic freedoms.
For Hong Kong, the biggest drop in democratic freedoms happens between 2018-2023, this makes sense because of the 2019-2020 protests. During these protests, the political situation in Hong Kong intensified, with Hong Kong’s government restricting elections, and further restricting democracy with the National Security Law years later. However, despite civil unrest, Hong Kong’s economy remained strong throughout this turbulant time period.
Regional Context Matters
Despite both having increasing government control, Hong Kong’s constant pursuit of economic growth remained strong even during political turmoil, in contrast to Venezuela’s sharp economic decline under similar political pressures.
Comparing Hong Kong and Venezuela highlights how global economic integration can buffer or exacerbate the effects of domestic political instability. While Venezuela’s economy suffered dramatically alongside democratic backsliding, Hong Kong’s tight integration with global markets helped sustain economic performance despite significant reductions in political freedoms.
Data Limitations as Learning
Working with real-world data taught me that:
- Perfect data doesn’t exist, you can only work with what’s available
- Transparency about limitations builds credibility
- Multiple indicators provide more robust insights than single metrics
- Political context is essential for interpreting quantitative measures
Technical Evolution
From DataVis to ShinyTesting
DataVis (First Attempt):
- Jumped into visualization without fully understanding the framework
- Struggled with reactive programming concepts
- Poor data exploration before analysis
Shinytesting (Second Attempt):
- Thoroughly read documentation and tutorials
- Built understanding of Shiny’s reactive model
- Extensive data exploration and cleaning phase
- Incremental development approach
Skills Progression
The contrast between these projects demonstrates:
- Learning from failure and applying lessons systematically
- Documentation and preparation as development fundamentals
- Iterative improvement in technical approach
- Domain knowledge integration with technical skills
Cultural and Academic Impact
Beyond Technical Skills
This project demonstrated my ability to:
- Apply technical skills to meaningful social questions
- Navigate cross-cultural data sensitivity
- Integrate academic research with interactive technology
- Present complex political-economic concepts accessibly
Research Methodology
- Transparent about data sources and limitations
- Multiple validation approaches for key findings
- User-driven exploration rather than predetermined conclusions
- Academic rigor combined with accessible presentation
Future Directions
Potential Extensions
- Real-time data interpretation based on major events in history
- Additional country comparisons to identify broader patterns
- Predictive modeling for economic-political trend forecasting
- Mobile-optimized version for broader accessibility
- Improved loading times for large datasets and visualizations
Methodology Improvements
- Advanced statistical techniques for correlation analysis
- Machine learning approaches for pattern recognition
- Geographic information systems integration
- User feedback mechanisms for continuous improvement
This project represents the intersection of personal curiosity, academic rigor, and technical capability. By using data analysis to explore questions that matter to me personally while developing sophisticated research and visualization skills.